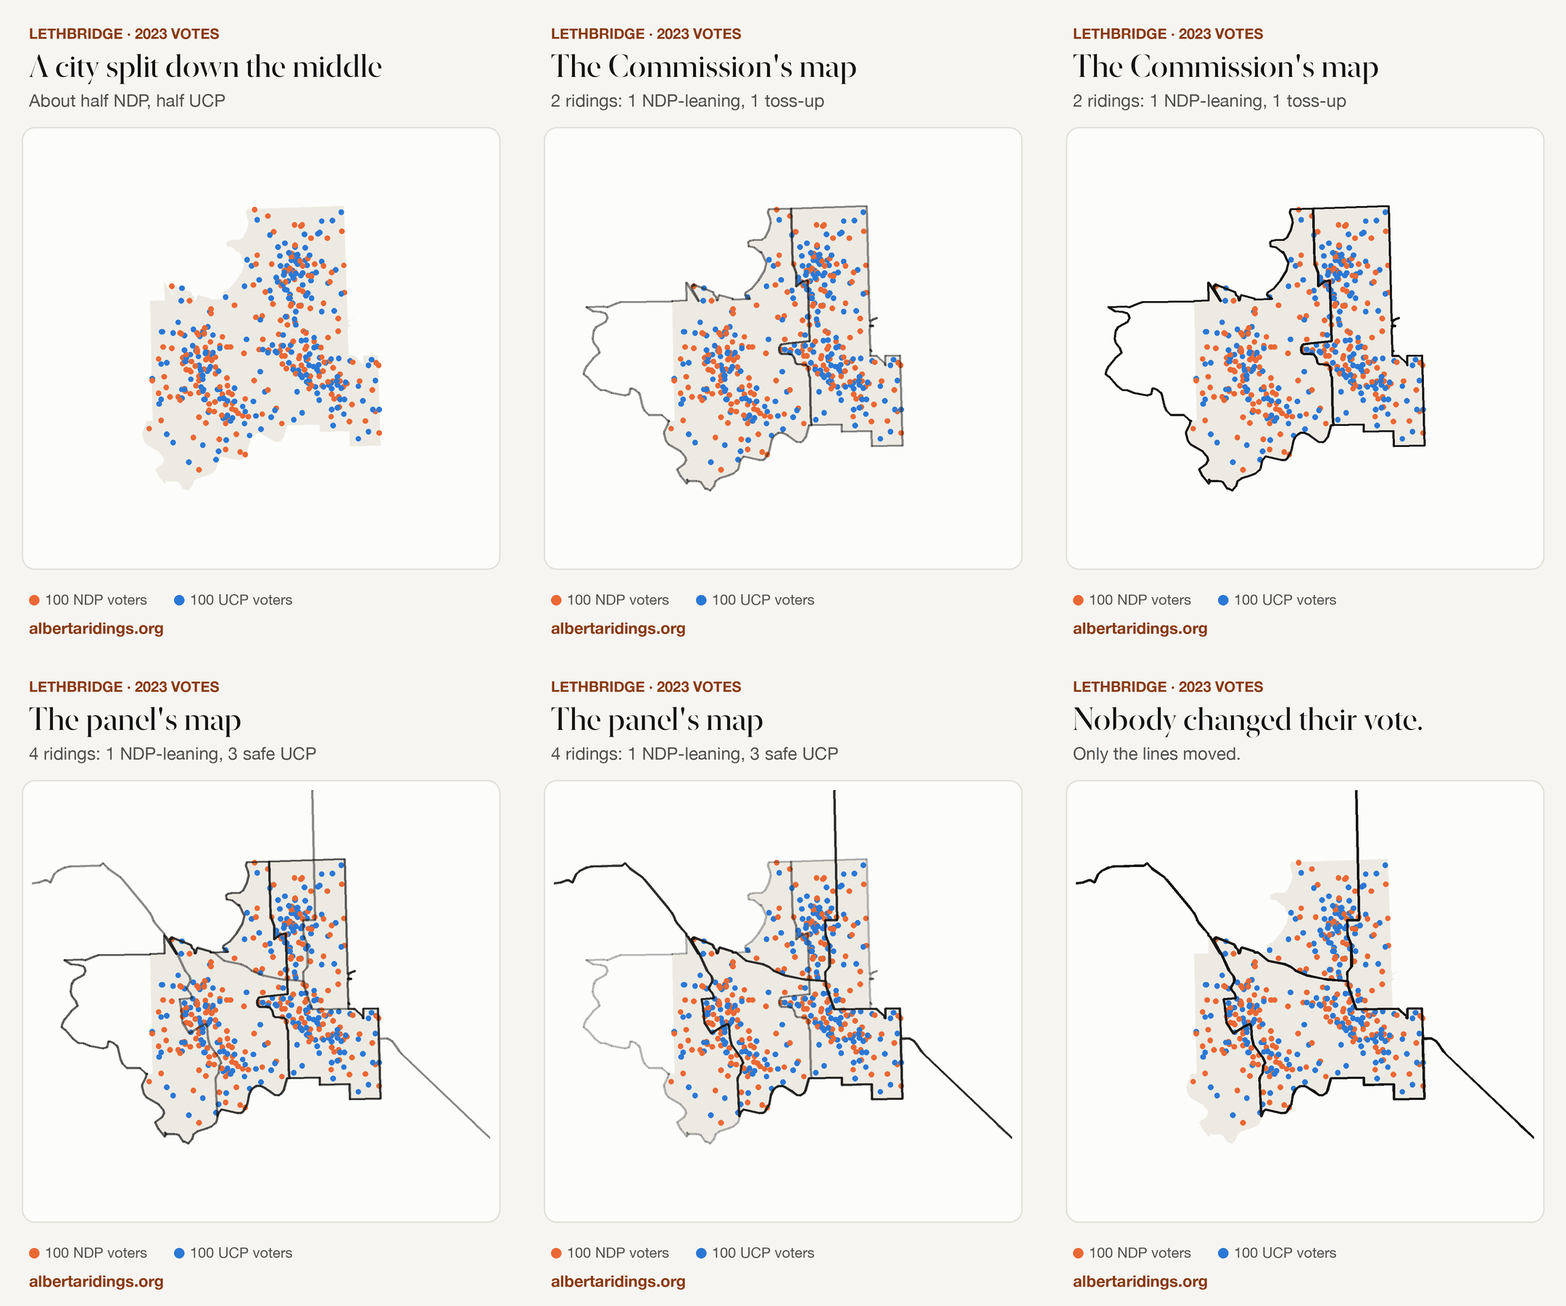
This is Lethbridge. Each dot is about 100 people who voted in Alberta's 2023 election, placed in their own neighbourhood.
Orange dots voted NDP. Blue dots voted UCP.
The city is split almost exactly down the middle: about half and half.
Every ten years or so, Alberta redraws its ridings. An independent commission proposed splitting Lethbridge into two ridings.
One leans NDP and the other is a toss-up.
The government set that map aside, and an advisory panel drew a new one.
The city is now cut into four ridings. One stays inside Lethbridge. The other three reach as far as 150 km out into the surrounding farm country.
In those three ridings, Lethbridge's evenly split voters are joined by many more rural voters, who vote heavily UCP.
The result: one NDP-leaning seat and three safe UCP seats.
Nobody changed their vote. Only the lines moved.
Splitting a mid-sized city happens fairly often, so is this unusual? The next section covers how district lines affect results.
1How lines decide elections
Imagine a town of 25 voters, split into 5 ridings of 5 voters each. Party Purple has 15 voters (60%) and Party Green has 10 (40%). Each riding elects whoever wins most of its 5 voters.
Packing
Squeeze as many of one side's voters as possible into a few ridings they win by huge margins. Their extra votes in those ridings change nothing.
Cracking
Spread a group's voters thinly across several ridings, so they fall short everywhere. Lethbridge's city voters in the three new rural ridings are an example.
Because voters live in clusters, every map packs and cracks somebody to some degree. A more useful test is whether a map does it more than usual, and consistently to one side. One way to check is to have a computer draw thousands of maps without any voting data.
2What would a neutral line-drawer do?
We asked a computer to split the same five-riding area around Lethbridge in tens of thousands of random ways. Every map follows the basic rules: five ridings, each in one connected piece, each within 25% of the average population. The computer has no voting data when it draws them.
3Now the whole province
We rebuilt all 91 proposed ridings from the official report and ran every 2023 ballot through them. Move the slider to try a different election result and see which ridings change hands and how many seats each map gives each party.
Or browse all 91 ridings. Communities split between ridings show the share of residents in each.
At a 50/50 tie, the Commission's map gives the NDP a majority and the panel's map splits the legislature almost evenly. A handful of ridings account for the difference.
4Five areas that changed the most
Each map below fades between the Commission's lines and the panel's, coloured by how the 2023 vote would have gone. Most of Alberta's 91 ridings barely changed between the two maps.
Put together, the new map gives the UCP about three more seats in a close election than the Commission's map did.
5What it adds up to
6Against tens of thousands of random provinces
An independent audit had already generated random valid maps for all of Alberta. Each falling dot below is about 50 of those maps, landing on the number of seats the UCP would win in a tied election.
What it shows
In a tied election the panel map gives the UCP more seats than 99% of random maps. The Commission majority map falls in the 82nd–94th percentile, and the minority map beyond the 99.9th. On other standard fairness measures (efficiency gap, mean-median, declination) the panel map is unremarkable.
Why the caution
Random maps ignore real-world considerations: communities, rivers, municipal lines, and the law's allowance for sparse rural areas. The comparison indicates direction and rough size. It says nothing about intent.
7Smaller ridings, safer seats
The law allows ridings to differ in population by up to 25%, and more in remote areas, so that a rural MLA isn't asked to cover an impossibly large area. This is usually called "effective representation". In Alberta it also has a partisan effect.
8How we rebuilt a map that came only as pictures
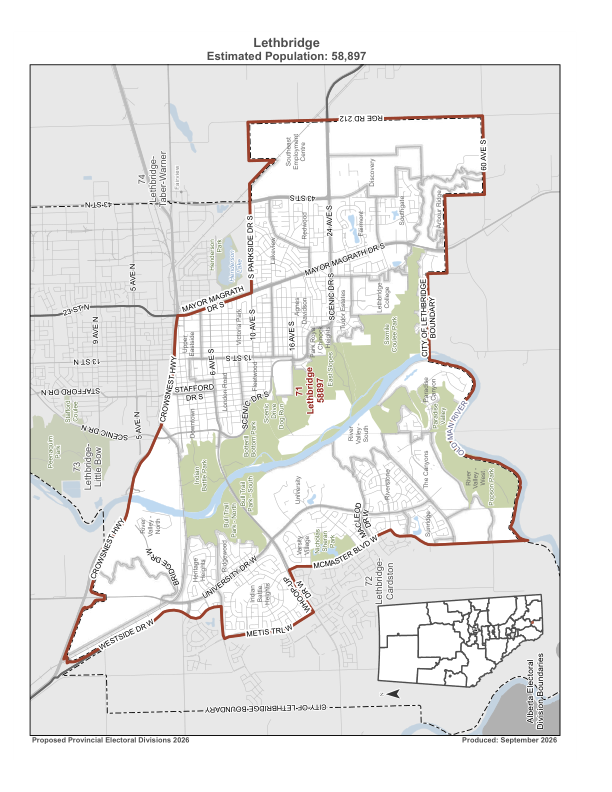
The panel's report included maps but no boundary files. A high-resolution edition held by the Legislature Library still contains each boundary as a drawing, which can be read back as geometry and fitted onto Elections Alberta's own voting areas.
Full method, data and checks
- Outlines were read from the PDF's drawing commands, one page per riding. The projection (Alberta 10TM) was confirmed from the province map's scales.
- Votes: election-day votes were split across voting areas by population, and advance, special and mobile ballots by turnout share. The totals match Elections Alberta's official results in every riding. Voting areas cut by a new line were split by area.
- Random maps (Lethbridge area): about 20,000 sampled maps per variant from a ReCom sampler on 300 voting areas, after burn-in. ±25% population, contiguous ridings, 2021 census population.
- Province-wide random maps are from the open-source audit Ixby/alberta-electoral-boundaries-audit. Its sample data was read, not re-run.
- Downloads: 91 rebuilt ridings (GeoJSON) · results by riding (CSV) · method notes · shareable animation (GIF)
9What this does and doesn't show
- It measures effects. Nothing here shows why any line was drawn where it was.
- Two of the three seats came from the Legislature's direction to the panel. The two restored ridings would favour whichever party is strong in those areas.
- The changes don't all favour one party. South of Edmonton, the new lines make an NDP seat safer. In Calgary, the much-debated Springbank additions barely move anything.
- It uses 2023 voters. People move and change their minds. The slider and the tie scenario assume every riding shifts by the same amount.
- The boundaries are reconstructions. They match the official ridings' areas and populations closely, but they are unofficial.
- It takes no position on legality. Whether the map is lawful or constitutional is a question for lawyers and the courts.
Quick glossary
About this analysis. This is an independent project with no party affiliation. It was built with the help of an AI system (Anthropic's Claude), which wrote and ran the extraction, fitting and analysis code under human direction. Every figure can be reproduced from the published inputs and the downloadable files. Corrections are welcome.
Every riding has its own page: browse all 91. An earlier, more technical version is archived at /v1.
Sources
- Select Special Committee on Electoral Boundaries: Independent Advisory Panel report (low- and high-resolution editions)
- Elections Alberta: maps and GIS boundary data
- Elections Alberta: 2023 official results
- 2025–2026 Alberta Electoral Boundaries Commission, Final Report
- Ixby/alberta-electoral-boundaries-audit (random-map samples, Commission map files, poll data)